Posted inMedicine
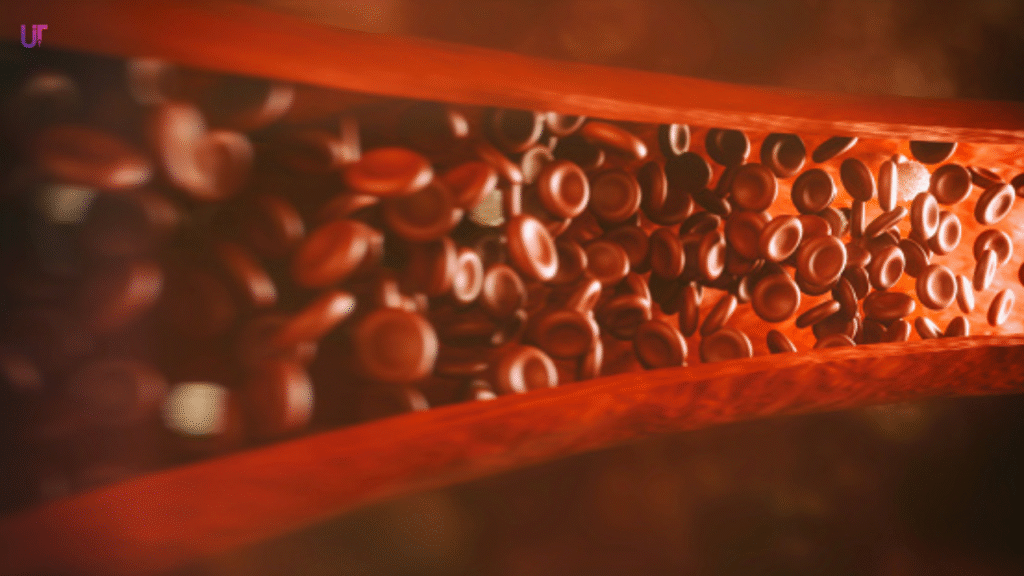
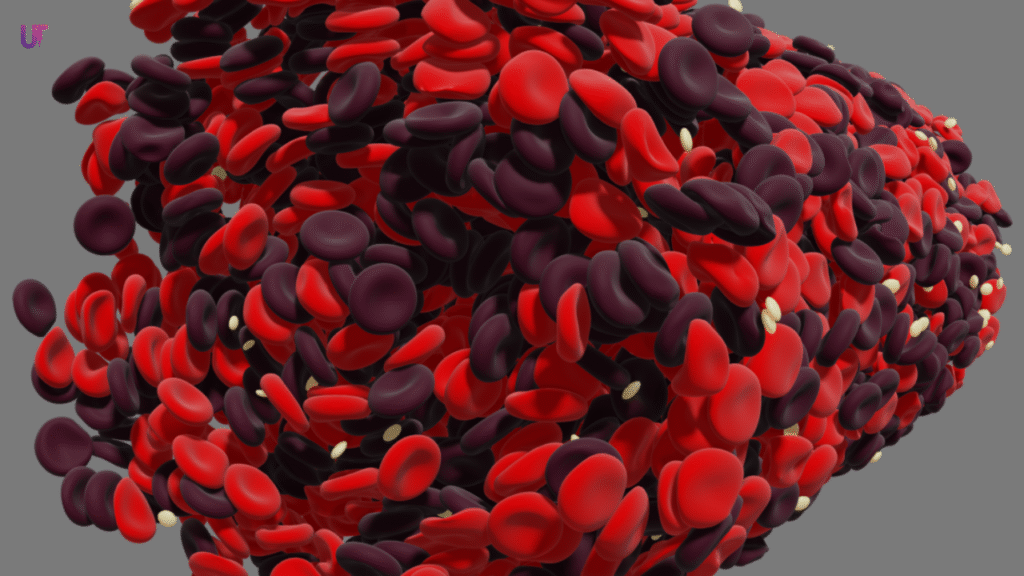
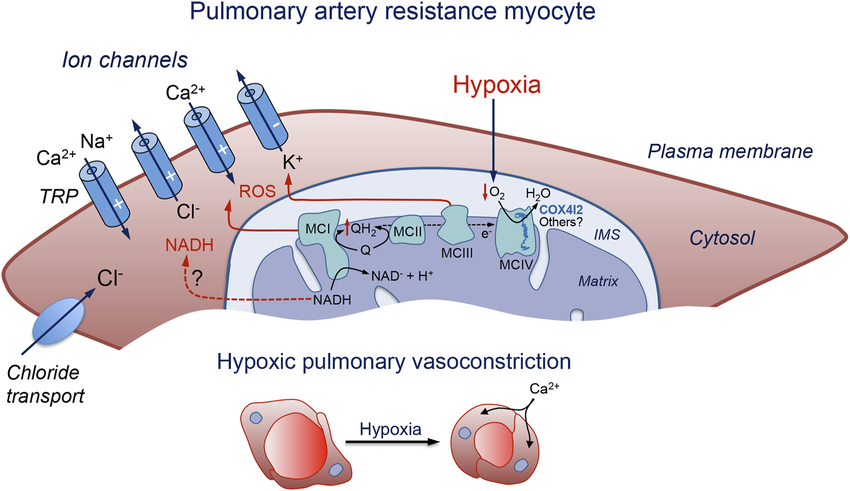
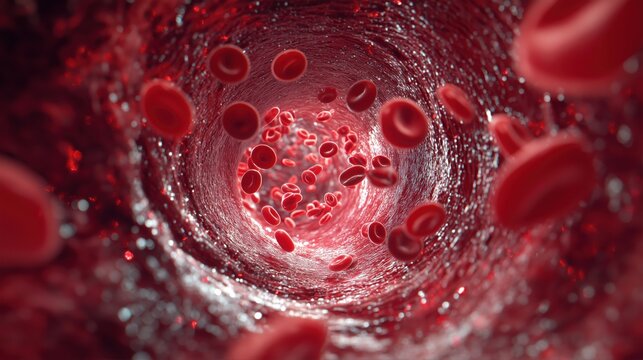
Endothelial Cells
Endothelial cells are the body's traffic controllers for blood. They constantly monitor the blood and the vessel wall, and in response, they release powerful chemicals that signal the surrounding smooth muscle cells to either relax or contract.